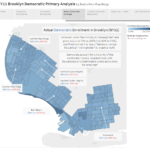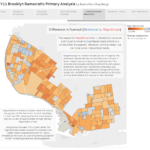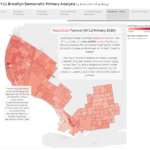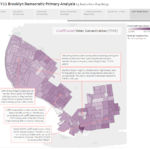
At A Glance
- Democratic turnout in Bay Ridge was higher than average.
- Republican turnout was lower than expected in their traditional “strongholds.”
- Democrats form a majority in nearly every electoral district in Southern Brooklyn.
- Strong ground game paid off more than social media.
Why Should We Analyze this Data?
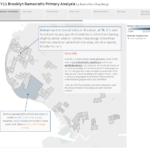
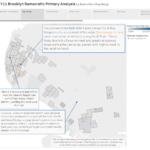
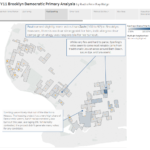
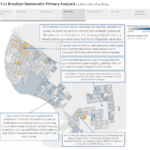
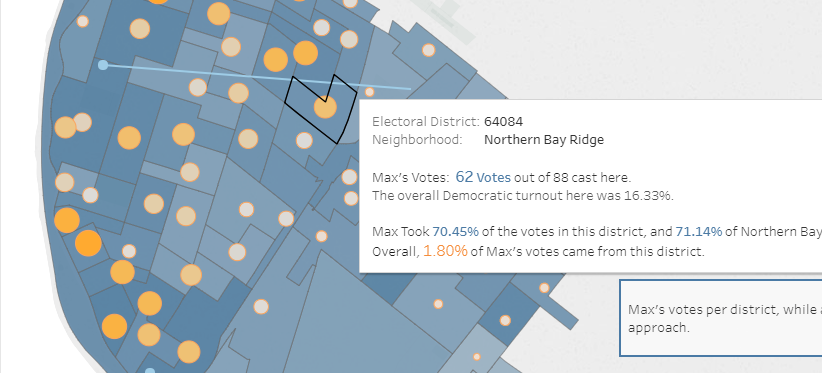
For the last few weeks, we’ve broken down the results of the recent 2018 NY-11 Democratic primary. Our map uses election night results
We think sharing this data is useful. It’s all public, but primaries often aren’t openly studied, especially in low-turnout elections. It also rarely happens in races with a large field of candidates… and certainly not by local analysts. It’s helpful for local progressives and voters to learn the makeup of the political districts they are a part of. It can help to know how elections play out, even for activists not interested in politics. Instead of letting various parties and campaigns gatekeep this sort of information, we felt it best to share it with the voting public, with our own insights added on top.
How We Analyzed the Data
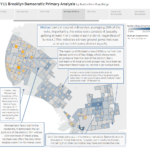
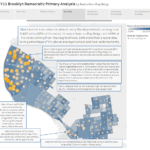
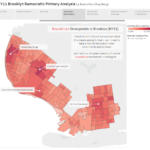
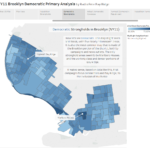
For our analysis, we decided to take the results from the Primary, broken down by each Electoral District and layered it with demographic data from the census. We paint a picture for each candidate in the NY-11 Democratic Primary, using their turnout to infer strategies and critique results of their campaign’s decisions. We decided that even candidates with low voter turnout deserved an in-depth look. Our maps begin with the candidates with the fewest votes, moving our way up to the winner, Max Rose. We also do some broad comparisons afterward to explore the links between Republican and Democratic turnout. We also highlight the role independent voters might play in the upcoming general election in November.
Caveats
Before you begin, we’d like to warn you that the turnout in Brooklyn as a whole was low, hovering around 8.5% for Democrats. That means the data is
… or check out the non-interactive version below!
Credits
This analysis was created in Tableau by Daniel Hetteix. All information was publically available through unofficial election night results broken down by Electoral District and OpenNYC geographic data.
