
At A Glance
- Turnout across the district increased, especially in Marine Park and Bay Ridge.
- Ross Barkan drove turnout for Cynthia Nixon.
- Andrew Gounardes has strong base support across the entire district.
- Certain conservative turnout strategies are showing hints of reduced effect.
Interactive Results Map
Browse the tabs below to see different maps and analysis from the SD-22 Democratic Primary. Hover over the map to see details from individual districts.

If the above embedded map does not load, you can check out our analysis over on our Tableau page. Click the link below!
Why Should We Analyze this Data?
For the past week, we’ve crunched the numbers on the recent 2018 SD-22 Democratic primary. The race was between Ross Barkan and Andrew Gounardes. Our map uses election night results to sum up how both candidates fared, as well as looking into how turnout has been changing across the district. We use the data, and the turnout, to make inferences about what sorts of strategies the candidates employed, and what larger trends are at play across the district.
We think sharing this data is essential. It’s all public, and local primaries are often left unanalyzed due to a lack of local knowledge. Also, this has been the first Democratic primary ever held in Senate District 22, providing interesting data on the state of the Democratic party across Southern Brooklyn. We hope that progressives, candidates, and people looking to run in the future can use this data to improve transparency about the electorate, and learn about their neighbors. Instead of letting various parties and campaigns gatekeep this sort of analysis, we felt it best to share it with the voting public, with our own insights added on top.
How We Analyzed the Data
For our analysis, we looked at the unofficial election night results. For our district, these were accurate enough to make broad conclusions about each Electoral District. Demographics and census data assisted in our analysis for each neighborhood.
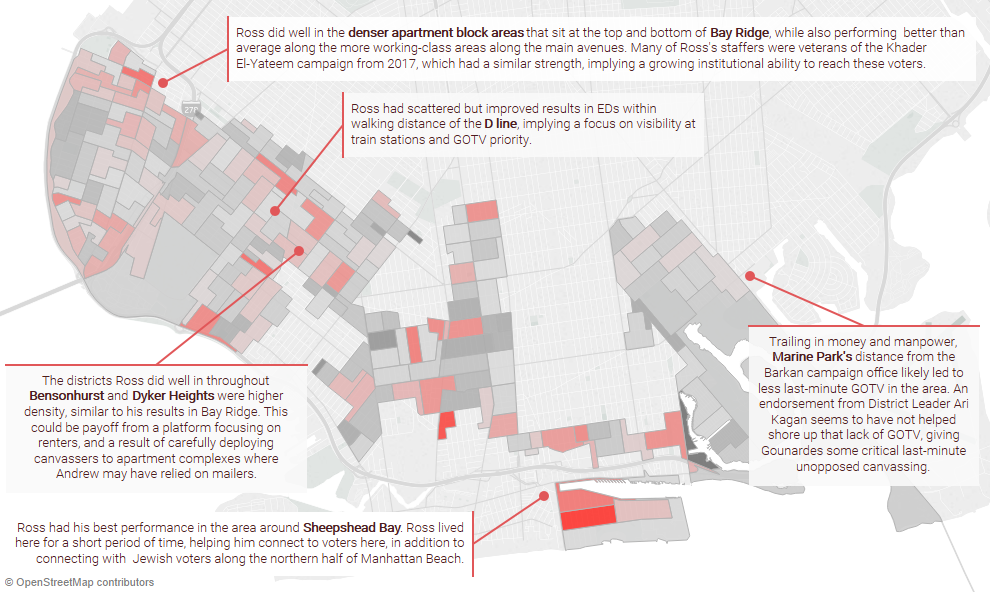
Since much of the map was won by Gounardes, we decided to reveal information in different ways. We looked at where Ross Barkan and Andrew Gounardes did well, based on their own average performance. That let us see where each candidate did well on their own terms.
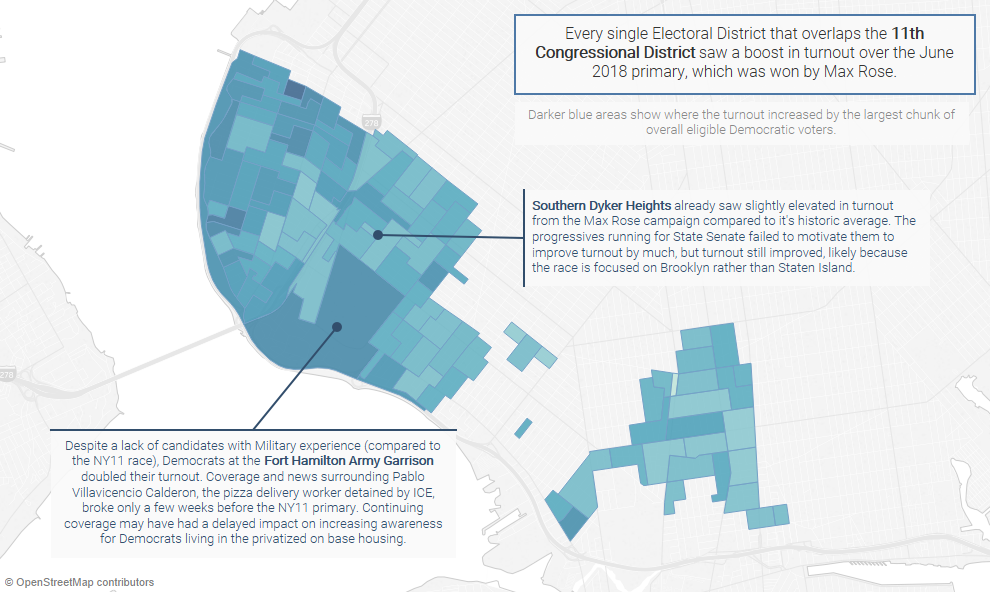
A big part of our analaysis also involved looking at the turnout. There was a huge increase in people heading to the polls in some areas. Other areas… not so much. To put that in perspective, we looked at turnout results from the NY-11 race this past June, as well as the Mayoral race from last year. We also compared the State Senate race to the Governors race that occurred on the same ballot, between Andrew Cuomo and Cynthia Nixon.
Caveats
Before you begin, we’d like to remind everyone that this data is based on public information, and represents our opinions only. We’ve used our own knowledge of the district, and our experience interviewing each candidate during the SD-22 Democratic Primary, to fill in the gaps and tie the data together a bit. That said, take everything with a grain of salt, and feel free to look at the data to make your own conclusions! We’re Bay Ridge residents first and foremost, and our knowledge of the district decreases the further out we go. If you have any comments, insights, or additional analysis, feel free to leave them in the comments section!
Non-Interactive Maps


Credits
This analysis was created in Tableau by Daniel Hetteix. All information was publically available through unofficial election night results broken down by Electoral District and OpenNYC geographic data.