Bay Ridge, Brooklyn experienced one of it’s lowest storefront vacancy rates this summer, with improvements on all major commercial avenues. This continues a trend since early March of new stores opening on 3rd Avenue, 5th Avenue, and 86th Street. Areas with organized Merchants Associations or BIDs had the most improvement.
The Big Picture
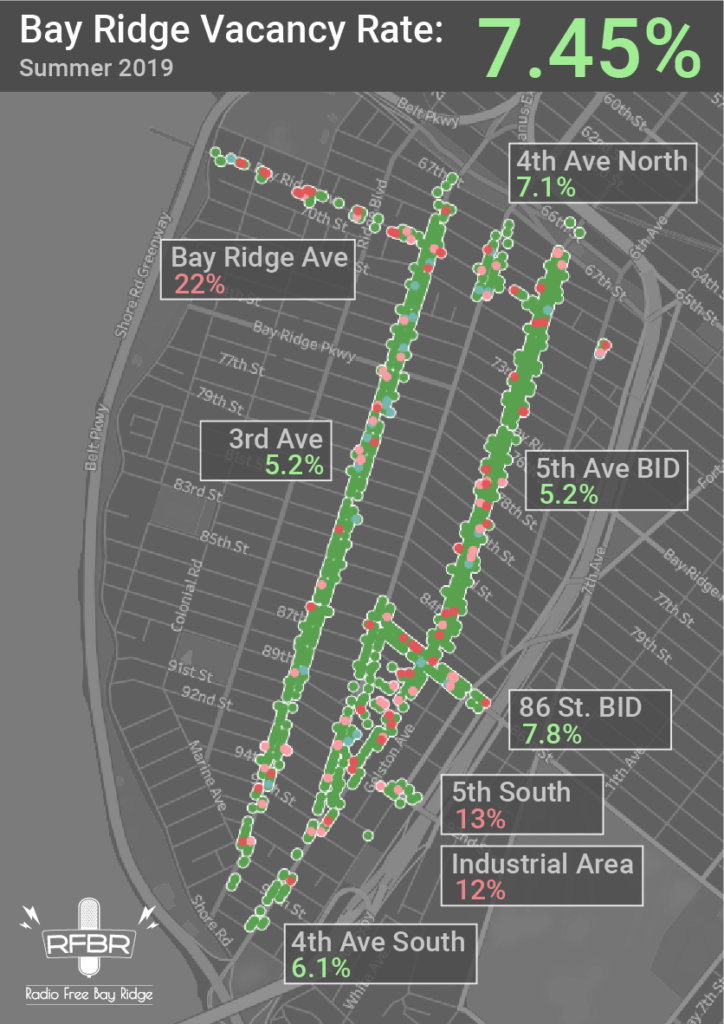
Bay Ridge’s vacancy rate is 7.45%.
This is significantly below the supposed citywide average of 12%. The ideal figure is 3-4%. Too few vacancies mean that new stores cannot open.
This is a departure from the March vacancy rate of 9.66%. This is because storefronts often experience seasonal cycles. It is possible that the supposed vacancy “crisis” in the neighborhood from 2018-2019 was due to a combination of factors:
- A few high-profile store closures
- A winter lull as new openings and renovations waited for warmer months
- Election-season drama
This isn’t to say that vacancy rates aren’t a concern citywide; it is. But Bay Ridge is doing very well compared to the city average, mostly due to the strong bond between residents and store owners.
Social Media vs Reality
When a beloved old store closes, we hear about it. When a new store opens, we often don’t… because it isn’t beloved yet.
It’s important to celebrate the 129 new stores that opened in Bay Ridge in the last eight months. There is also proof that our neighborhood’s love of shopping local is enticing store owners to seek out Bay Ridge. You can listen to an example of that in the last public comment in our 3rd Avenue BID recording: a merchant who wanted to move their store from Gravesend to Bay Ridge entirely due to the turnout at our Summer Strolls.
Bay Ridge’s storefronts are recovering from winter downturns. Property owners are investing in building renovations and construction. Most stores do not stay vacant for long periods of time. Overall, Bay Ridge seems to be in good shape.

In More Detail…
How did the BIDs do?
Short answer: great.
| Business Improvement District | Rate | BID Average | City Average |
| Bay Ridge 5th Avenue BID | 5.20% | 8.9% | 12% |
| 86th Street BID | 7.88% | 8.9% | 12% |
When focusing in on the Business Improvement Districts, both the 5th Avenue BID and the 86th Street BID did better than the supposed city average of ~12% vacancy. It also outperformed other BIDs citywide, which on average have a vacancy rate of 8.9%.
Importantly, the BID areas saw the largest improvements (considering their size). The 5th Avenue BID, which covers the blocks north of 85th street, shifted two percentage points in under six months. The 86th Street BID improved by five points.
How did the smaller commercial areas do?
Bay Ridge Avenue was the most distressed, with 22.77% vacancy. The Industrial area between 92nd and 87th street was also distressed, slightly exceeding the city average.
It’s with block-by-block, season-by-season reporting that we get a better picture of Bay Ridge’s commercial success. There isn’t a trend toward vacancy… though some areas are worse than others. No commercial area of Bay Ridge has gotten worse since this winter.
| Commercial Area | Winter | Summer | Change |
| Bay Ridge Avenue | 24.75% | 22.77% | +1.98% |
| 4th Ave (North) | 14.29% | 7.14% | +7.15% |
| 4th Ave (South) | 8.77% | 6.14% | +2.63 |
| 5th Ave (South) | 15.22% | 13.04% | +2.18% |
| 92nd St. Overpass | 9.52% | 9.52% | 0% |
| Industrial Triangle (92nd-87th st) | 16.79% | 12.21% | +4.58% |
Some areas recovered dramatically, such as 4th Avenue North (the area around Bay Ridge Avenue). This area had taken a big hit by the station closure in 2017, and new tenants like Blend made big changes in the vacancy rate.
Other areas are experiencing issues related to their location.
Bay Ridge Avenue has been struggling since the ferry to Staten Island stopped running in the ’60s. In the ’90s a multiplex was proposed at 15 Bay Ridge Avenue, which Community Board 10 rejected as being out of character with the nearby residences. The avenue has remained sleepy, with low foot-traffic resulting in more offices and inward-facing businesses that don’t cater to the shoppers.
This brings us to a major reason why the 86th Street, 3rd Avenue, and 5th Avenue always seem to rebound from winter vacancies:
Placemaking

An occupied storefront is not necessarily an engaging storefront.
During our surveys, we found a number of properties being used for storage. Other times, stores were staffed by appointment only. More often, they were simply businesses that didn’t “engage” with the street at all, with the people inside hiding behind blinds or grates.
This can contribute to a false sense of vacancy and decline in an area.

When too many stores aren’t inviting to passers-by, the avenue can feel empty. This can be countered with an urban planning process called “placemaking“, where a sense of uniqueness and identity is actively encouraged in a public space. This can be done with new policies, public art projects, street redesigns, or collaborating with neighbors and store owners to foster a sense of community.
The Fifth Avenue BID is tackling this head-on with a focus on marketing and a new placemaking study for 2019-2020 led by Sarah Aita.
Comparing Fifth and Third
5th Avenue has fewer vacancies than 3rd Avenue this summer and rebounded faster from its winter vacancy rate.
It is difficult to compare Fifth Avenue and Third Avenue, mainly because twice as many homes in Bay Ridge are closer to Third Avenue…
| This Avenue… | Is closest to… | Which means it’s supported by… |
| Third Avenue | 4th Ave to Shore Road | 4.5 residential blocks per commercial block |
| Fifth Avenue | 4th Ave to 7th Ave | 2.5 residential blocks per commercial block |
Fifth Avenue also has fewer stores, with only 404 storefronts compared to Third Avenue’s 556. Transit options are relatively even, with both 5th and 3rd equally distant to the subway, with bus lines on both avenues.
However, the Fifth Avenue BID helps the avenue punch above its weight.
Based on this year’s data, Fifth recovered fastest from its winter vacancy rate, and currently has the lowest vacancy rate in Bay Ridge. Combined with some of its inherent disadvantages, its success is likely due to the actions of it’s Business Improvement District. You can learn more about what the Fifth Avenue BID does in our episode from earlier this year.
Key Takeaways
No. Bay Ridge consistently performs better than the city and national average, and it’s major commercial corridors are within a few percentage points of an ideal vacancy rate.
According to surveys by Radio Free Bay Ridge, 7.45% of stores were vacant or actively seeking renters in August 2019. On major commercial corridors, that number is closer to 6%.
Most sources agree that it is between 3-4%.
Future Reporting
We’ll be updating our maps every few months in 2019 and 2020. In June of 2020 the City Council bill that requires property owners to list their vacancies takes effect. At that point, we’ll reanalyze whether our seasonal count is still necessary.
Some caveats: Our Vacancy studies were made with in-person site visits to every store in Bay Ridge on a regular basis. When confronted with stores that were shut but not explicitly for rent, we made every attempt to ascertain their status via. social media, most recent online review, business incorporation records, etc. There may be small errors in our data based on the uncertainty in classifying some stores, though we erred on the side of classifying stores as vacant. As such, the actual vacancy rate may be lower than we report here. Additionally, when errors are found in previous data sets, we correct and update them. Specifically, this occurs as we learn new data about a storefront on subsequent walkthroughs (perhaps the owners were out for vacation and so we accidentally deemed it closed). As such, previous data sets may change slightly over subsequent months.
Note: If you feel a storefront was labeled inaccurately, let us know by contacting us at [email protected] and we will update it for our next report in January 2020!