Welcome to our analysis of the November 2019 Public Advocate elections, focused specifically on Bay Ridge, Brooklyn. We’re going to dig into how Jumaane Williams and Joe Borelli’s results compare to recent elections… briefly. Because more excitingly, this data had lots of unique quirks. The Ballot Proposals let us look at how voters feel about land use, voting reforms, and NYPD oversight. The Libertarian Party also appeared for the first time on the ballot. Finally, we’ll take a peek at Conservative Party voter identity, which might play a role in the 2020 Elections.
Data Geek Alert!
As always, take our analyses with a grain of salt! We try very hard for accuracy, but voting numbers require many leaps of logic. Sometimes we may have gone too far, or missed interesting circumstances. This analysis is intended to get you thinking, and we hope you make your own judgments based on the data provided.
The Public Advocates
Jumanne Williams
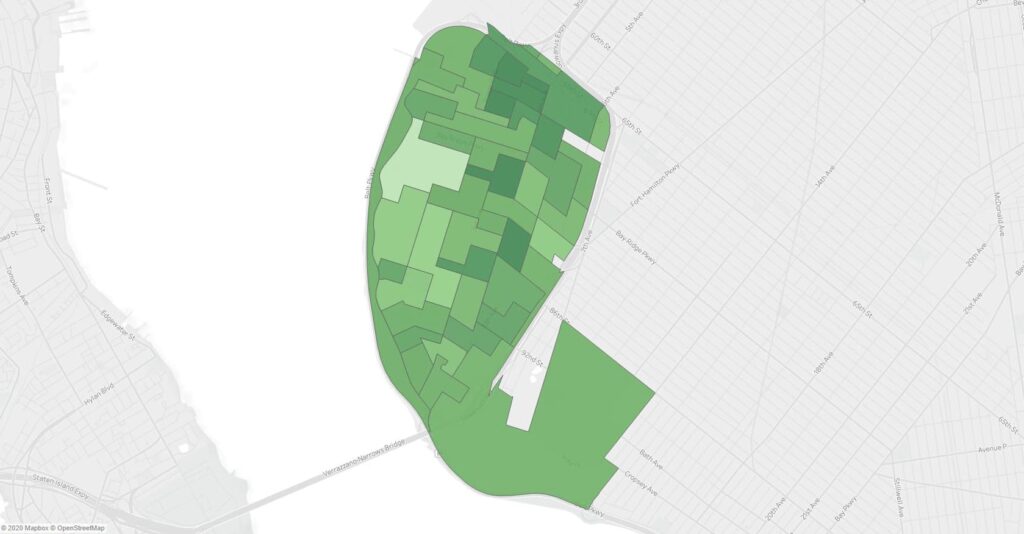
The clear winner in the November Public Advocate election was Jumaane Williams. He took 60% of Bay Ridge’s vote! Is that good? Well, not really. Williams took 84% of the vote citywide. The only place in Bay Ridge that came close to that ratio was Northern Bay Ridge. Those districts, which have many immigrant and minority voters, went 72% for Williams.
Joe Borelli
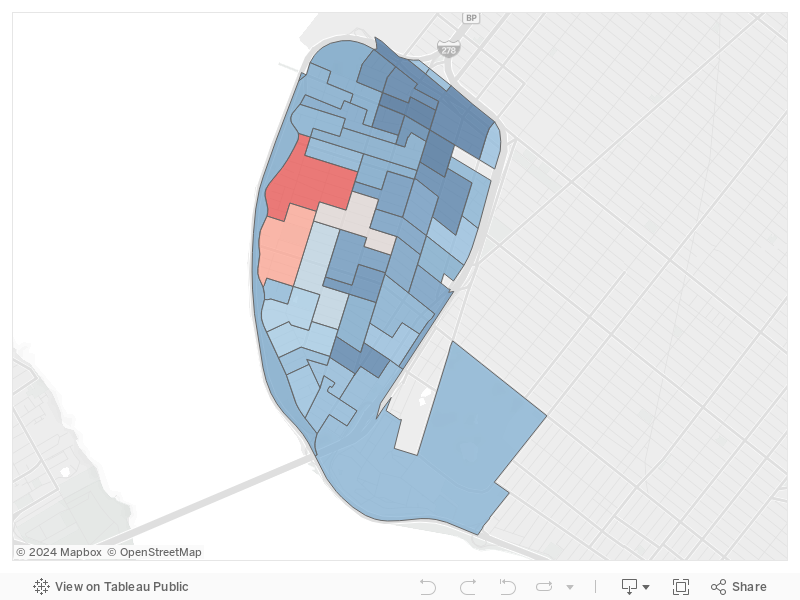
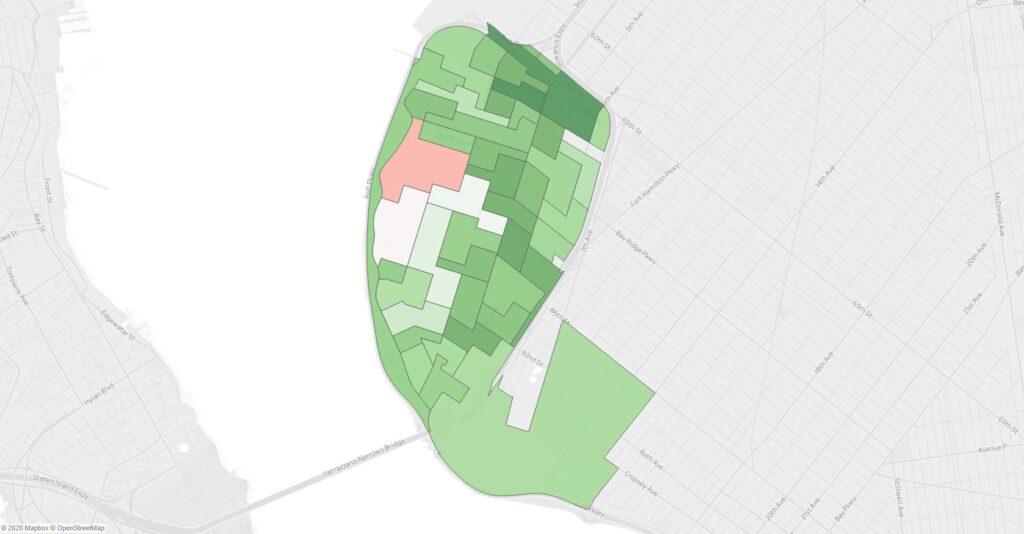
Yes, the map above looks pretty blue. Republican Joe Borelli won only two of Bay Ridge’s 54 Electoral Districts. Despite this, he had wide appeal among right-leaning moderates throughout Bay Ridge. This cut into Williams’ totals, resulting in Borelli taking almost 40% of Bay Ridge’s total vote.
The districts that Borelli won outright centers on the “Gold Coast” of Bay Ridge. For local residents, this is unsurprising. The area contains many of the neighborhood’s biggest mansions and skews wealthy. The boundaries of the area are 3rd Avenue to the east, Bay Ridge Parkway to the north, Shore Road to the west, and Fort Hamilton High School to the south. Most Republican votes in Bay Ridge come from this specific area.
Comparing Borelli’s Results to Other Republicans
Compared to Mary Golden’s performance in 2018, Borelli was about even. He took 37% of the neighborhood, compared to Golden’s 36%. However, turnout was much lower for Borelli. Deep in the heart of Republican Bay Ridge (ED 64089) he only managed to turn out 187 votes, compared to Golden’s 336. This low turnout held true for Democrats as well.
However, Republicans tend to do better in low-turnout elections. Borelli likely would have fared much worse than Golden if turnout was higher. There are a lot more Democrats than Republicans in Bay Ridge, and increased turnout helps them more.
Still, turnout was better than the Special Election in February. The Ulrich vs Williams contest had dismal turnout. For example, that ED we mentioned where Borelli got 187 votes? Ulrich only extracted 98 votes from the same district.
One interesting side note:
Borelli improved on Ulrich’s performance by nearly 3 percentage points neighborhood-wide. But that didn’t hold true in key districts. He did 10 percentage points worse in ED46051. That’s the area just north of Fort Hamilton High School. It’s one of the wealthiest electoral districts in the neighborhood. It’s a Republican “stronghold”. For it to swing 10 points away from Republicans in under 10 months is startling. Sure, high turnout helps Democrats… but not by that much.
Libertarian Bay Ridge
How’d the Libertarians Do Citywide?
But the Public Advocates were the least interesting thing about the race. Republicans won Republican areas, with some qualifiers. Democrats did the same. There is a trend toward lower Republican voting power in Bay Ridge. This election continued that trend.
Instead, we’re more excited about the new data the election gave us! For example, the Libertarian Party appeared on the ballot for the first time. So how’d they do?
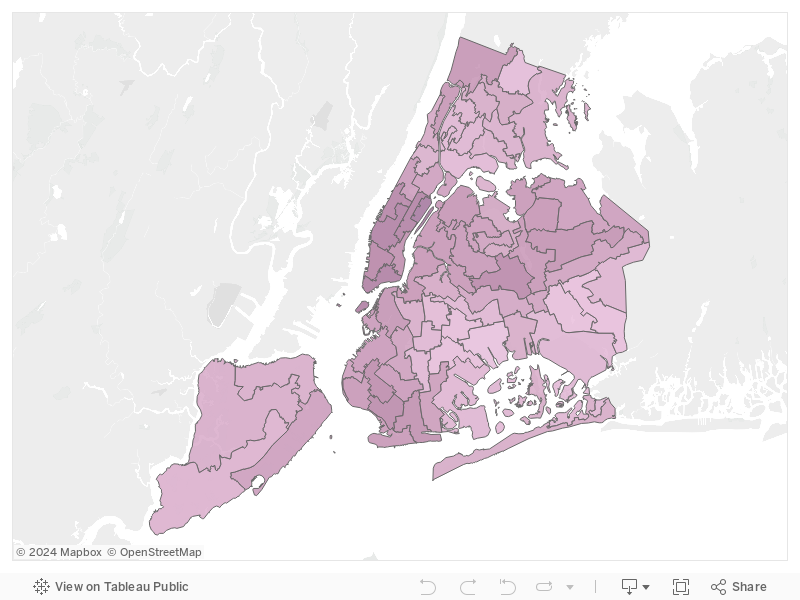
It’s not shocking to see Libertarian voters tend to be in Manhattan. They accounted for 3% of the Manhattan vote. In contrast, Staten Island and the Bronx had barely half that. Overall, Libertarian support was stronger in wealthier (and whiter) neighborhoods.
How Does Bay Ridge Compare?
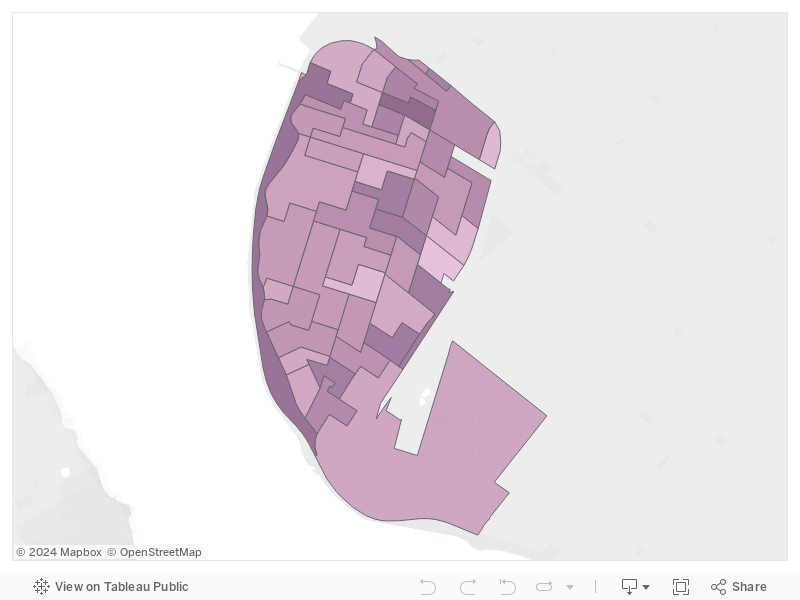
Bay Ridge was an exception to Brooklyn’s low Libertarian support. Bay Ridge averaged about 3% Libertarian, similar to Manhattan. But it gets more extreme. Manhattan’s most libertarian area was the Upper East Side at 4% Libertarian. Some districts in Northern and Eastern Bay Ridge averaged even higher at 5-6%.
Bay Ridge was an exception to Brooklyn’s relatively low levels of Libertarian support.
The Libertarian support in Northern Bay Ridge matches the area we previously determined to have high numbers of enrolled Democrats who vote Republican. These are the so-called “Giuliani Democrats”.
The rest exist along the area between 3rd and 5th Avenues north of 86th Street. These are not traditional Republican areas… but do have lots of single-family brownstones. That makes them perfect for new (and somewhat well-off) parents. This fits with the Libertarian trend toward younger Millennial voters.
All of this Libertarian data is brand new, though. To confirm any trends, we’d want to see data across a few more elections.
Republican or Conservative?
Let’s leave the Libertarian Party and focus on something much older. The Conservative Party of New York State.
You shouldn’t confuse The Conservative Party with being conservative. It’s very far-right on social issues and remains avowedly anti-LGBTQ. Rudy Giuliani was too liberal for their endorsement!
The party started in the ’60s and has had many power centers over the decades. But the modern Conservative Party has its roots in Bay Ridge.
For example, did you know that the Conservative Party has its state-wide HQ above Skinflints? Or that former Bay Ridge councilman Mike Long (of Long’s Liquors) was its longtime state chairman until Gerard Kassar, Marty Golden’s former Chief of Staff, took over as state chairman a year ago.
The Conservative Party has put lots of effort into maintaining its relevancy in Bay Ridge. Kassar was a key figure in Golden’s failed re-election bid. He then failed upward to state-wide chairman. He’s now the primary force behind Nicole Malliotakis’s campaign. So we figured we’d take a peek and see how they did this election, and whether they did better now that it wasn’t raining.
Hints of Disloyalty
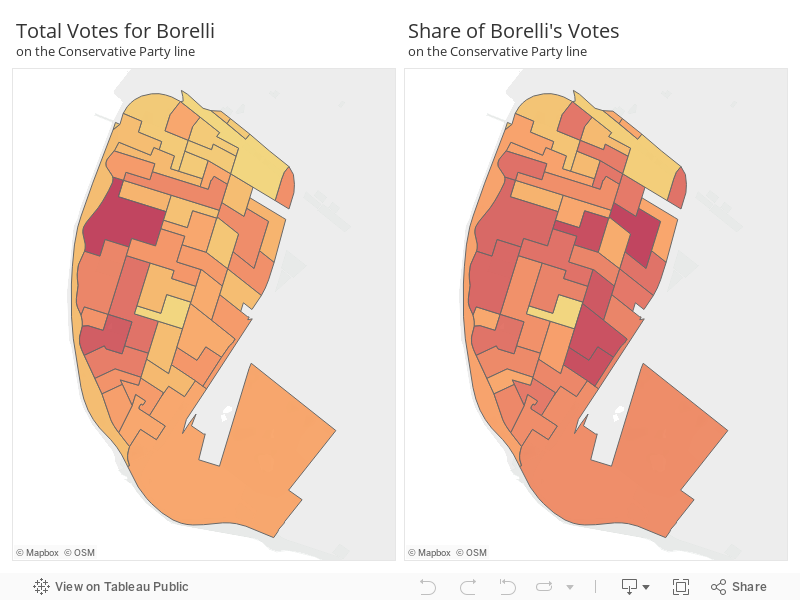
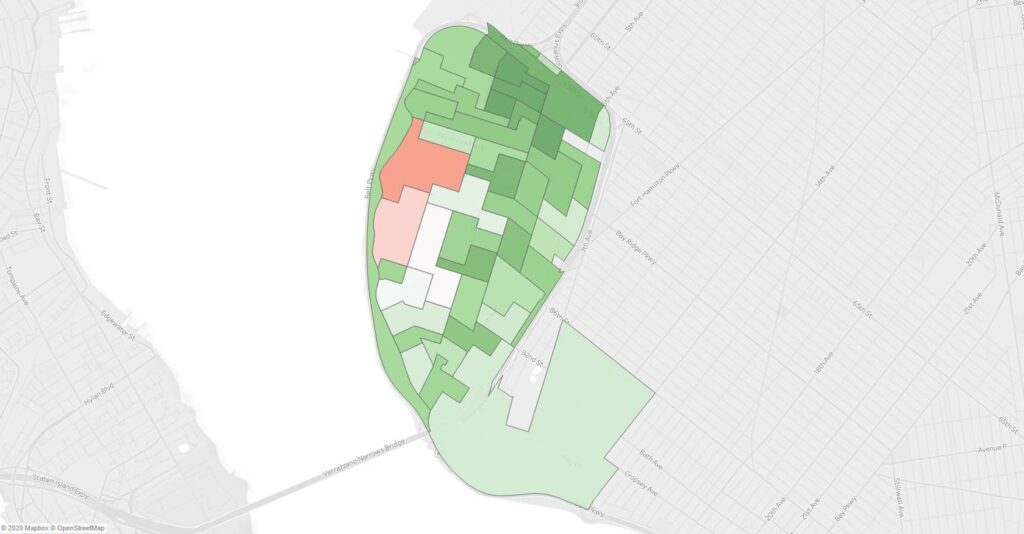
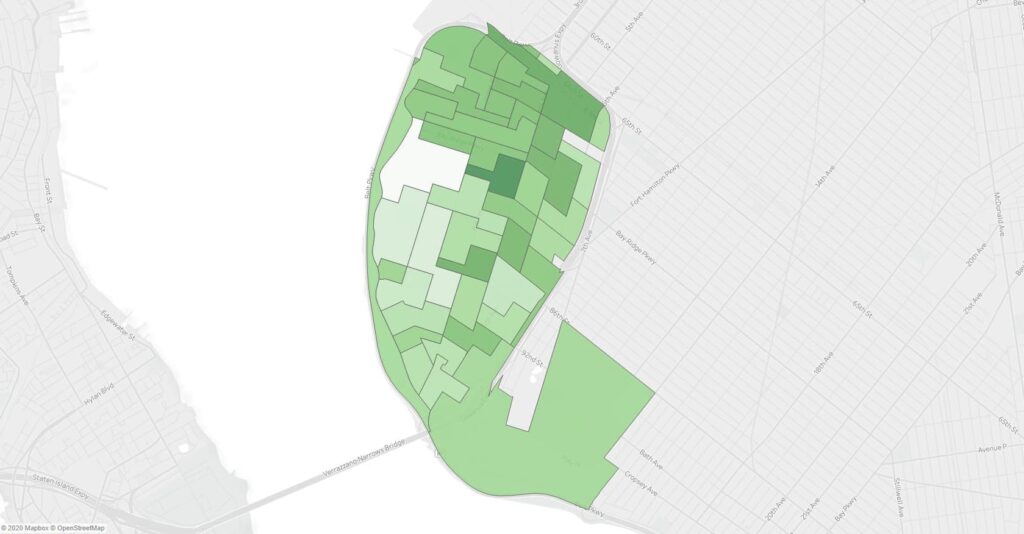
The above map shows an interesting nuance. On the left are total Conservative Party votes for Borelli. The right side shows the ratio of Conservative to Republican votes. The deeper orange areas have more Conservatives. There are two immediate conclusions.
First, look to the shore. The Conservative party has lots of raw votes among the fancy mansions. But it’s not convincing a lot of Republicans to vote away from their usual party line, accounting for less than a quarter of Borelli’s vote.
That’s OK though. The Conservative Party draws power by being a spoiler. When Conservative Party voters remain loyal, they can deny 15-20% of the right-wing vote from Republicans they refuse to endorse. In a district that’s hard for Republicans to win, not getting Conservative backing is a death sentence.
But the Conservative Party loyalty factor isn’t certain. We’re intrigued that Conservatives took a larger share of Borelli’s vote along 3rd and 5th. It’s possible this is Kassars “Millenial outreach” at work… but we haven’t seen any evidence he followed through on that. Also, these are the same areas Libertarians are doing well in. Libertarians are much more socially left-wing than the Conservative Party. It’s doubtful that outreach among such a narrow, limited demographic would result in gains by both parties.
Still, we’re talking about one discrepancy among a small subset of voters in a medium-turnout election. For further proof, we need to check in on the Ballot Measures.
The Ballot Measures
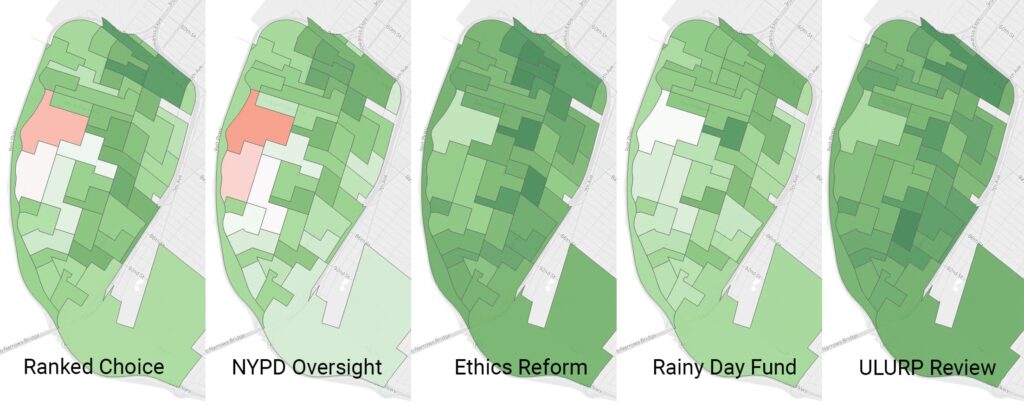
More interesting than the actual Public Advocate election were the five ballot measures. They ran the gamut from controversial to boring. Some focused on NYPD oversight. Others focused on the Universal Land Use Review Procedure (ULURP).
Understanding a ballot measure requires a lot of effort. Many people skip the ballot measures. Others answer the same way on all of them. It’s known as decision fatigue, and it makes analyzing ballot measures messy. But, combined with our previous analysis, we can make some interesting deductions. How loyal voters are to their party platforms, for instance!
Let’s take a look.
Ranked-Choice Voting
Ranked Choice Voting was first on the ballot. It’s pretty limited. The reform only applies to primaries and special elections, not general elections. It’d also only apply to municipal elections. That means city council, public advocate, mayor, etc.
The Conservative Party strongly opposed the ballot measure. So did the NY Post and the Republican Party. Conservative opposition centered on technical issues and the possibility of fraud. A handful of Democratic lawmakers opposed the measure too. They claimed it harmed the chances for minority candidates.
Conservative Party Voters May Not Be Voting How Their Leadership Wants Them To
Data Geek Alert!
We’re about to talk about correlation. Basically, it’s a number that indicates if two variables are closely linked. The scale goes from negative 1 to positive 1. Numbers between 0.3 and -0.3 usually mean no correlation. The closer you get to the extremes, the more correlation there is between the two variables. Check out the end of our analysis for caveats and more on correlation.
Districts that voted for Borelli on the Republican ticket tended to vote against Ranked Choice Voting… but the correlation was much weaker for districts that voted for Borelli on the Conservative Party ticket. This happened despite strong opposition from Conservative Party leadership. This could mean one of two things:
Theory One. Conservative Party voters are less informed about their party’s platform than Republicans. This might be a result of campaign tactics that appeal to emotions rather than facts. In the long run, this makes the Conservative voting base unable to identify key party issues on a ballot. This would be especially true for complex ballot proposals.
Theory Two. Conservative Party voters are voting based on the name “conservative” rather than agreeing with the party’s platform. This could indicate the presence of Republican “protest” votes. Perhaps some moderate-right voters couldn’t bring themselves to vote for the Republican party… but liked Borelli. The Conservative Party was their way to avoid voting Republican.
A Paper Tiger?
Our money is on theory two. The pattern syncs up with all the other data we’ve collected so far. It explains why there are higher shares of conservative votes in moderate areas. It explains why Libertarians were popular in those areas. And it syncs up with the overall decline of right-wing politics in Bay Ridge.
It also provides more evidence that the Conservative Party is transforming into a paper tiger. If they can’t vote more reliably or loyally than an average Republican then their spoiler power is weakened. Especially in Bay Ridge, their home turf. It suggests a fundamental death-spiral that can’t be explained away by turnout or weather.
That theory seems much more believable than the alternative: that the Conservative Party is making sudden inroads into young and minority voting blocs… all while losing successive local elections.
It may also suggest that four years of Donald Trump’s extremism is taking its toll on Republican moderates. They’re checking out. And even the core Republican districts in Bay Ridge are getting burned out. Remember that district Borelli did 10 points worse in than the more moderate Ulrich?
Importantly, this lack of loyalty to the Conservative Party platform isn’t a fluke. On all five ballot measures, Conservatives voted against their party’s interest more often than Republicans.
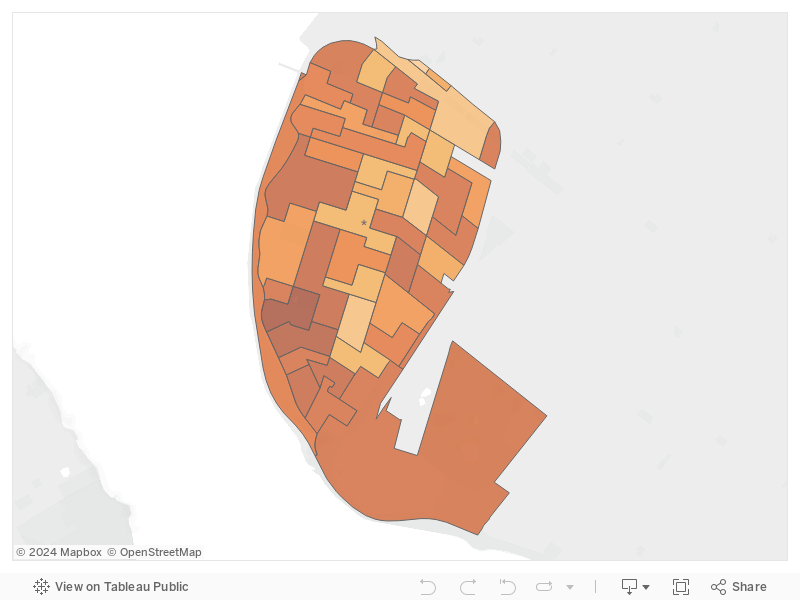
Where Do People Mistrust the Police?
OK, this shouldn’t come as a surprise. NYPD civilian oversight was the most polarizing ballot measure. But it shows decades of police abuse in Northern Bay Ridge. That area was strongly in favor of NYPD reform. Arab-Americans there (and city-wide) have been subjected to severe and illegal surveillance.
Support also came from the buildings on and between 3rd and 5th Avenue. This likely included voters from our growing Latinx community. They face significant policing injustice. For instance, the increasing number of local ICE raids. Yes, ICE is federal and not related to NYPD oversight. But it has changed the mood around the subject of policing. Bay Ridge for Social Justice provides a good example. Their latest MLK day event focused on alternatives to policing.
Obviously, the Conservative and Republican parties opposed the measure. Libertarians and Democrats supported it. Libertarian-voting districts didn’t see any positive correlation though.
Ethics Reform
This ballot measure included some general ethics reforms packaged together. That included improving the Conflict of Interests Board, which keeps track of city corruption. It also extends the ban on politicians being lobbyists.
But the Libertarian, Conservative, and Republican parties took issue with it. Specifically, they opposed reforms to the Minority- and Women-Owned Business Enterprise (M/WBE) program. Adding the program into the charter will make it harder for lawmakers to eliminate the program.
The disapproval from the right-wing didn’t mean much. Support for this measure was one of the strongest in the entire neighborhood. Not a single district voted against it. ED64089, the strongest Republican district, saw the measure win by 10 points.
Rainy Day Fund
The Rainy Day fund played out similarly. The Conservative and Republican parties opposed it, as did Libertarians. Opposition boiled down to fiscal conservatism. There was fear that, by forcing the city to save money, it’d be harder to push through tax cuts.
It won by fewer votes than the general reform package, but it won in every district. The smaller margins were likely due to general distrust of City Government and how they spend money.
A Note About Libertarian Correlations
One note, though, about Libertarian support thus far.
The Libertarian Party came out against the last two ballot measures. But Libertarians voters had no correlation one way or the other. This isn’t surprising for a party being on the ballot for the first time. Their voters likely aren’t aware of their Manhattan party leadership’s exact positions. It takes time to build party leadership and awareness. This might be why their correlations are weak on all the ballot measures.
There’s another explanation though. The Libertarian vote is small. We may not have a large enough sample size to generate strong correlations in the first place.
Community Board Fans
The final ballot measure dealt with giving Community Boards more time to review plans related to new development in the neighborhood. When large developments are proposed, it triggers a process known as ULURP, or Universal Land Use Review Procedure. Community Boards are required to weigh in, and this ballot gives them more time to do so.
ULURP is a complex thing. It can be hard to understand, and Community Boards fly under the radar. But this was a ballot measure that ended up being very embarrassing.
The New York Young Republicans were against it. The NY Post was against it. Most Republicans were against it. But the Conservative party supported the proposal. And, seemingly, none of their voters listened.
It’s possible that the voters simply were too used to voting “no” on the proposals. Maybe it was just a knee-jerk thing to seeing the word “Land Use” and thinking “Development”. But as we already explained, something explains it better. Conservative Party voters have no idea what the Conservative Party is. At the very least, they don’t listen to their leadership. They’re much more influenced by mainstream Republican talking points.
Who Ignored the Ballot Measures?
Overall, as the ballot questions progressed, fewer and fewer people responded to them. It is very possible this is simply due to fatigue. As voters tired of reading ballot explanations, they simply skipped them instead.
It is also possible that the more interesting ballot questions came first, such as voting rights and NYPD oversight. The latter questions were definitely more arcane. This could also explain the dropoff.
Interestingly, there was almost no correlation between candidate preference and a district’s likelihood to skip ballot questions. Democratic districts had an incredibly slight, statistically negligible, tendency to skip questions. Conservative Party districts had a slight, occasionally statistically significant, tendency to answer the ballot questions. Unfortunately, that meant more frequently voting against their party’s actual position.
Absentees and Affidavits
Where did people have a problem voting?
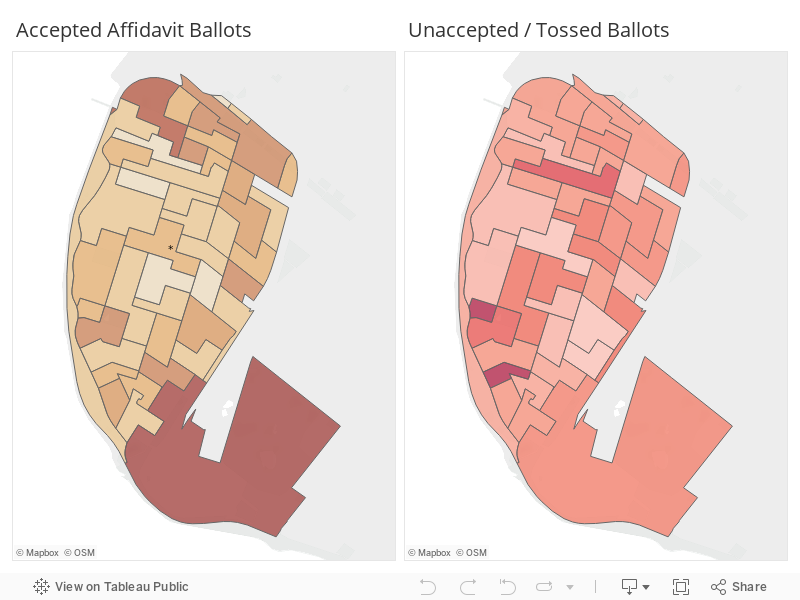
Above, you can see two maps that show where voting problems occur in Bay Ridge. The left map shows where election officials accepted affidavit ballots. The right shows where officials tossed ballots or deemed them invalid.
Affidavit ballots happen when a voter shows up to the wrong voting site or has problems with registration. Tossed votes can occur for the same reasons, or when people incorrectly fill in ballots. Both occur in specific areas of Bay Ridge.
Southern Bay Ridge, by the shore, has high numbers of older residents. This includes the Shore Hill senior housing complex. They had high levels of tossed ballots. Ten ballots were “unrecorded” in the district that included Shore Hill. To put that in perspective, it was about 2.5% of the total vote there. Better poll assistance for seniors is needed.
The other area with higher-than-average voting problems was Northern Bay Ridge. This area has lots of voters who do not speak English. Many speak it as a second or third language. It is an area that needs major reform to translation services. The State Board of Elections currently bans translators for specific languages at polling sites. This includes bans on many of the languages spoken in Bay Ridge.
Local Councilman Justin Brannan has been vocal about fixing this form of voter suppression. Sadly, the Board of Elections sued the city to halt on-site translations in 2019. Thus, the state ended up forcing the city’s translation services 100 feet outside of polling places. Locally, it didn’t matter much. No Bay Ridge locations received these services. Arabic, Greek, and Italian were not among the city’s supplemental languages.
The Absentees
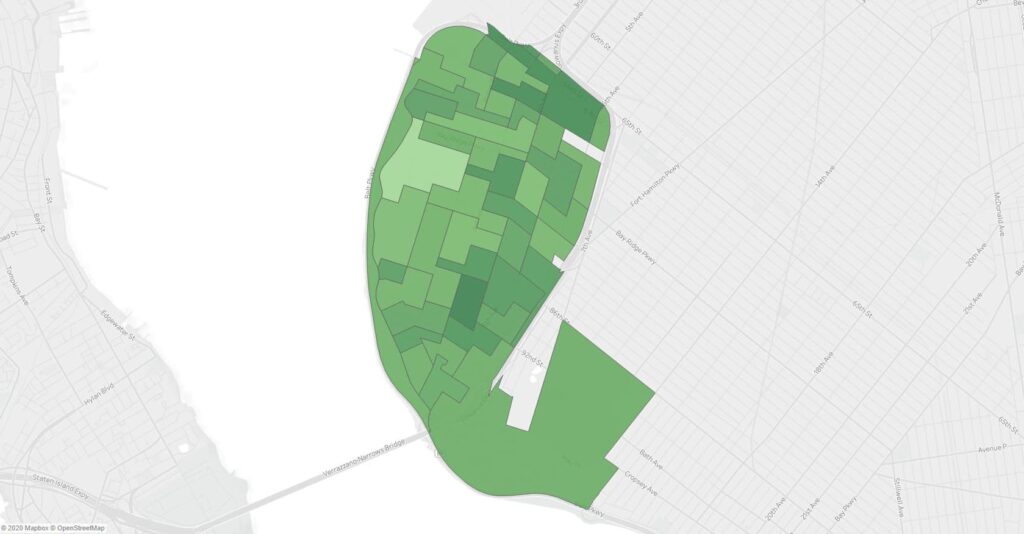
We’ll end our analysis with a look at who wasn’t here on election day. The map above shows where voters sent in absentee ballots. In general, the wealthier the area, the more people sent in absentee ballots.
Locally, absentee votes usually skew Republican. It’s what Marty Golden was counting on in 2018. The large number of absentee votes in right-wing districts backs that up. It likely happens because richer residents along the shore tend to be “snowbirds”. That is, they winter in secondary homes in warmer climates.
State Taxes are hard to escape if you own large properties. The mansions along Shore Road are probably big red flags for auditors. Thus, there isn’t a reason for very wealthy homeowners to stop listing Bay Ridge as their primary residence (short of committing serious tax fraud). This means that even people who only live in Bay Ridge for 3-4 months out of the year still vote in the district.
Wrapping Up
If you’ve read this far… thank you! We take our analysis here at Radio Free Bay Ridge seriously. Keep in mind though, no analysis is perfect. We’re still relying on inference and observation. We encourage you to make your own decisions with the data provided.
Specifically, this is the first time we’re using correlations. We think it was a big help in ensuring our inferences were accurate. But we fully acknowledge that we need to conduct these correlations across multiple elections, especially for the Conservative Party. Expect those deep dives coming soon!
You can check out all our maps and data directly on Tableau. It’s freely available for download. If you find any errors or want to help improve our data and analysis, feel free to email us at [email protected].