Bay Ridge is luckier than most outer borough neighborhoods. Residents have multiple transit options, from trains to bikes to buses to ferries. However, last year’s transit situation was so bad that it was known city-wide as the “Summer of Hell”. Bay Ridge Avenue was closed for six months as part of a new “Enhanced Station Initiative”. This upgrade was spearheaded by our local State Senator Marty Golden, who sits on the MTA Capital Review Board. However, as cosmetic upgrades were being installed, service worsened across the board with little relief. Today we dig into the numbers and analyze 2017’s transit numbers, and what they mean for Bay Ridge.
We were happy to sit down with our transportation correspondent, Brian Hedden in this episode. We focus on the subways and buses, but also cover all aspects of Bay Ridge transit, including tolls, biking, and ferries.
Bay Ridge Subway Ridership
During the episode we analyze the ridership for two Bay Ridge subway stops. We chose 95th Street and 86th Street. This is because Bay Ridge Avenue was shut down for half of 2017 for “upgrades“. This forced our analysis to focus on the southern part of Bay Ridge because data was compromised in Northern Bay Ridge. We have, however, revealed the entire data set for Bay Ridge subway stations below.
Weekday Ridership (Avg. / Per Day)
Bay Ridge ridership dropped twice as much as the city average. Cosmetic upgrades haven’t improved service.
During weekdays, you can see significant drops at 86th and 95th street. The city average was a 1% decline in ridership. Bay Ridge’s commute is bad enough to result in over a 2% decline, nearly double the city average.
| Subway Station | 2016 Ridership | 2017 Ridership | % Change |
| Bay Ridge Avenue* | 8,415 | 4,173 | -50.4% |
| 77th Street* | 5,720 | 6,746 | +17.9% |
| 86th Street | 12,078 | 11,742 | -2.8% |
| 95th Street | 6,090 | 5,969 | -2.0% |
* These stations were excluded from our analysis since Bay Ridge Avenue was closed for nearly 6 months. Increases at 77th are due to some Bay Ridge Ave. riders walking to 77th instead, and heavy declines at Bay Ridge Ave. are because it only was open half the year. 86th and 95th street better reflect overall neighborhood trends.
Weekend Ridership (Avg. / Per Day)
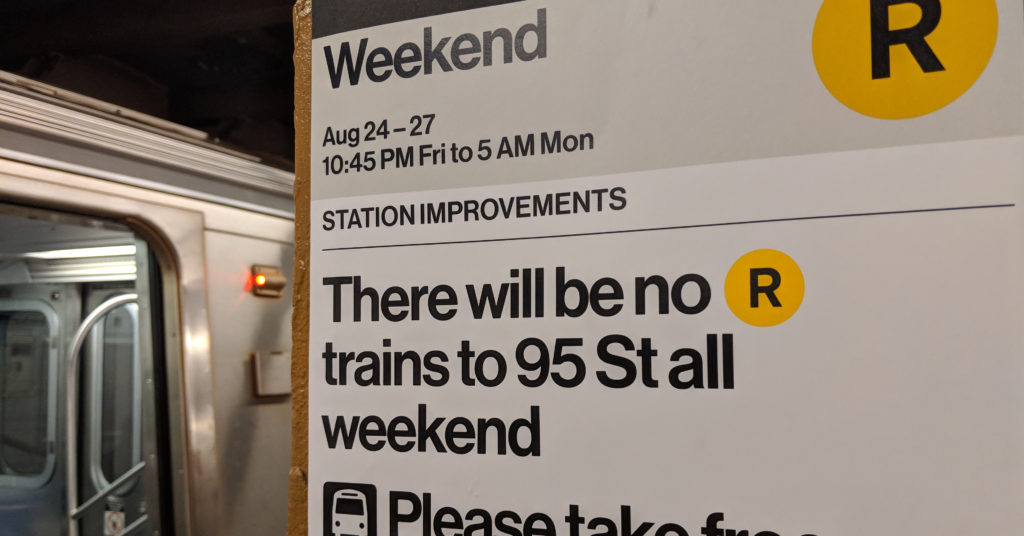
Constant weekend shutdowns hurt ridership, even when the trains were running.
During weekends, you can see the result of the still unexplained R Train shutdowns. A staggering 20% of our weekends were affected by full shutdowns in 2017. Still, this is less than the 20-21% declines in actual ridership. The constant shutdowns likely depressed ridership even on weekends where the trains were actually running.
| Subway Station | 2016 Ridership | 2017 Ridership | % Change |
| Bay Ridge Avenue* | 8,719 | 4,005 | -54.1% |
| 77th Street* | 5,247 | 4,881 | -7.0% |
| 86th Street | 12,263 | 9,662 | -21.2% |
| 95th Street | 5,510 | 4,361 | -20.9% |
* These stations were excluded from our analysis since Bay Ridge Avenue was closed for nearly 6 months. Increases at 77th are due to some Bay Ridge Ave. riders walking to 77th instead, and heavy declines at Bay Ridge Ave. are because it only was open half the year. 86th and 95th street better reflect overall neighborhood trends.
Bay Ridge Bus Ridership
Weekday Ridership (Avg / Per Day)
Subway riders may have switched to slower but more reliable buses along the R Train route.
Most buses saw moderate decreases in ridership or held steady. The exceptions are the B37 and B63, which run down 3rd and 5th Ave, respectively. Based on the subway data, it seems that some riders fleeing R Train delays and signal problems instead decided to take the bus. The B70 also saw a significant boost (more on that later).
| Bus Route | 2016 Ridership | 2017 Ridership | % Change |
| B1 (To Manhattan Beach) | 19,828 | 18,987 | -4.2% |
| B4 (To Sheepshead) | 6,195 | 6,207 | +0.2% |
| B8 (To Flatbush) | 19,616 | 18,981 | -3.2% |
| B9 (To Marine Park) | 14,404 | 14,495 | +0.6% |
| B16 (To Prospect Park) | 6,739 | 6,760 | +0.3% |
| B37 (To Downtown Brooklyn) | 2,380 | 2,558 | +7.5% |
| B63 (To Downtown Brooklyn) | 11,607 | 12,008 | +3.5% |
| B64 (To Coney Island) | 5,732 | 5,273 | -8.0% |
| B70 (To Industry City) | 5,942 | 6,229 | +4.8% |
| S53 (To Staten Island) | 9,378 | 9,136 | -2.6% |
| S79 (To Staten Island) | 11,378 | 11,266 | -1.0% |
| X27/37 (To Manhattan) | 3,106 | 3,041 | -2.1% |
Please note that these numbers are for the entire route, not just Bay Ridge. During the episode, we discuss how and when the MTA might eventually collect data by bus stop. It likely will occur when the Metrocard is phased out in the coming years.
Weekend Ridership (Avg / Per Day)
Like the weekday, weekend ridership increases on the B37 and B63 don’t seem to be because bus service is good, but that train service is worse. You can see it more dramatically here due to the persistent weekend shutdowns causing a +27% boost to the B37. The B63 saw a large boost as well, but not by as much. This can be explained by the terrain: the B63 sits uphill from 4th Avenue for a big stretch, especially in Sunset Park. It’s a difficult climb, especially for seniors looking for an alternate transit route.
| Bus Route | 2016 Ridership | 2017 Ridership | % Change |
| B1 (To Manhattan Beach) | 21,601 | 21,218 | -1.8% |
| B4 (To Sheepshead) | 6,235 | 6,308 | +1.2% |
| B8 (To Flatbush) | 22,245 | 21,529 | -3.2% |
| B9 (To Marine Park) | 17,200 | 17,225 | +0.1% |
| B16 (To Prospect Park) | 5,880 | 5,921 | +0.7% |
| B37 (To Downtown Brooklyn) | 2,158 | 2,749 | +27.4% |
| B63 (To Downtown Brooklyn) | 18,371 | 19,978 | +8.7% |
| B64 (To Coney Island) | 7,424 | 7,123 | -4.1% |
| B70 (To Industry City) | 7,113 | 7,938 | +11.6% |
| S53 (To Staten Island) | 13,056 | 12,825 | -1.8% |
| S79 (To Staten Island) | 14,212 | 14,589 | +2.7% |
| X27/37 (To Manhattan) | 913 | 968 | +6.0% |
Please note that these numbers are for the entire route, not just Bay Ridge. During the episode, we discuss how and when the MTA might eventually collect data by bus stop. It likely will occur when the Metrocard is phased out in the coming years.
The B70 Increase
The B70 Bus was a bright spot. There is increased ridership between Bay Ridge, Sunset Park, Boro Park and the Brooklyn Waterfront.
The B70 bus saw significant increases that can’t be tied to R Train failures. It also only connects a few neighborhoods, making its data more relevant to Bay Ridge. This makes it unique in our analysis. The line connects Bay Ridge, Sunset Park, Boro Park, and Industry City along the waterfront. Sunset Park and Industry City have seen heavy increases in both population and economic growth lately, which may explain the ridership growth.
Importantly, these increases occur on weekdays, indicating that Bay Ridge is seeing commuters and job opportunities in these neighborhoods. Weekend growth is increased too, implying shopping and leisure. In short, these neighborhoods are seeing an increased cultural and economic connection with Bay Ridge.
Ferry Service
A lack of transparency limits analysis. Rockaway Ferries remain crowded for second year in a row.
Lack of Data
The NYC Ferry Service, operated by Hornblower, is managed by the NYEDC. The Economic Development Corporation has not released comprehensive ridership data for its ferry lines. Most ridership numbers come from limited press releases with narrow time frames. This limits our ability to make an analysis… and makes it worse than the MTA in terms of transparency.
Regardless, while Ferries are an enjoyable transit option, they are expensive and have a very low capacity. Even at their ideal ridership levels, the entire ferry systems total annual ridership would barely equal a single day of subway ridership.
Rockaway Crowding
We spent some time discussing the Rockaway Ferry route, which lands at the Sunset Park pier at 59th street. Due to crowding in 2017, this year, a change was made to run express service from Wall Street to the Rockaways, bypassing the stop. This was done to relieve crowding, but all it seems to have done is reduce stops at Sunset and increase crowding.
Bicycling
Unreliable and expensive manual counting limits analysis. Automated solutions remain expensive.
Counting Bikes in Bay Ridge
Among our other discussions, we mention that bicycling numbers and ridership in Bay Ridge, like much of the city, is reliant on very shaky data. However, a bright point has been the Manhattan Bridge Bike Counter.
These counters cost around $20,000 dollars each, however, and rely on expensive ground-induction loops installed in the pavement. There have been other attempts at more cost-effective bicyclist monitoring over the years, but none have yet been successful.
Luckily, Bay Ridge may be suited for bike commuting analysis, since we are bounded by highways. There are only fourteen ways to bike into and out of Bay Ridge, at specific crossings over and below the BQE and the Belt. Sixteen including pedestrian overpasses. While this wouldn’t give an idea of biking occurring within Bay Ridge, it would provide hard data on how many bike commuters exist in the neighborhood. Further, smaller counters without displays would be much cheaper than the $20,000 system installed at the Manhattan Bridge.